
The Portfolio Calendar gives you a single, property-by-date overview of every property in your group, so you can spot where attention is needed across your whole portfolio without opening each property's calendar one by one.
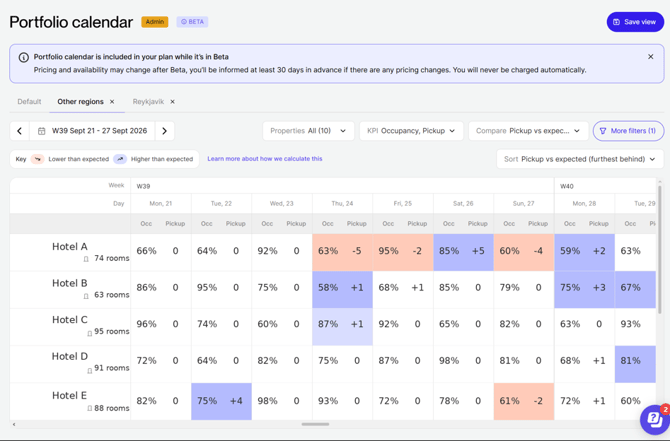
- Each row is a property, showing its name and room count (e.g. "Hotel A… · 68 rooms"). The property column stays frozen on the left as you scroll.
- Columns are grouped by week, with infinite horizontal scroll: future dates load automatically as you scroll, past dates load on demand as you scroll left.
- Week boundaries follow each property's own week-start day, not one global start day across the portfolio, worth knowing if a client with mixed week conventions asks.
- The grid is entirely read-only: there are no editable cells or bulk actions here.
Choosing your KPIs
You can display up to 3 KPIs as columns per property:
- Occupancy, Pickup, and Price — available on every plan, no add-on required
- Revenue, ADR, and RevPAR — require Reporting to be enabled on the account
Compare (color coding) Compare is a separate control that decides what drives the color coding on each cell, it doesn't change or recalculate the underlying KPI data itself. There are three options, plus None:
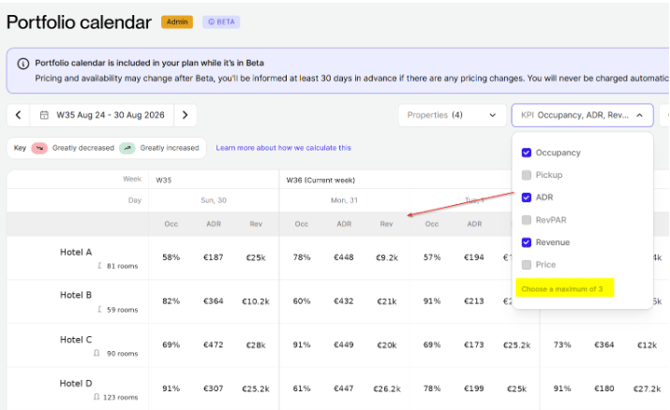
Note: If Price is selected, it only shows the price of the reference room type, not a breakdown across all room types.
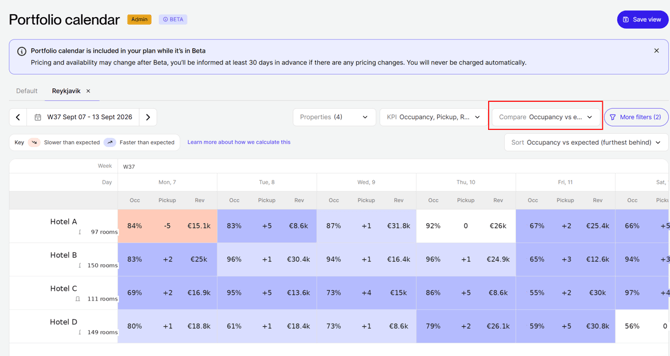
- Occupancy vs expected — compares on-the-books occupancy against what the system expects for that date, based on the booking window and target occupancy set in the property's Occupancy Strategy settings. Coloured from slower than expected (orange tones) to faster than expected (purple/blue tones).
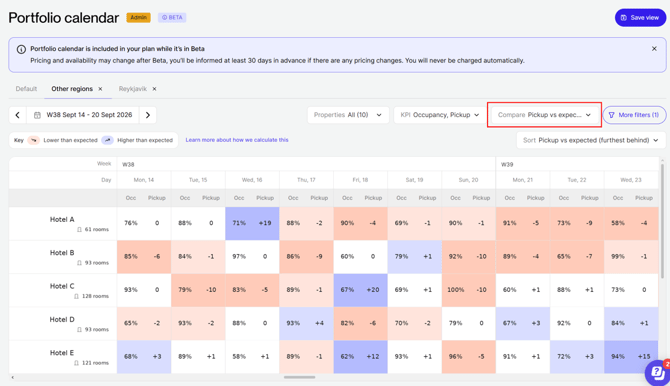
- Pickup vs expected — compares pickup captured during the selected period against what's expected, using that same booking window and target occupancy logic. Same orange-to-purple scale.
- Pickup vs actual — compares pickup day over day. Zero pickup is neutral (no colour); negative pickup shows in red (darker = more negative), positive pickup shows in green (darker = higher).
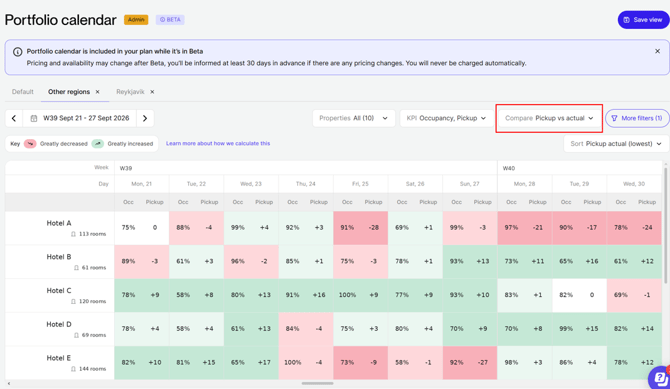
Changing Compare can also change row order if sorting isn't locked to a fixed option like property name (A–Z), since some sort options are relative to the selected comparison, not a bug, just worth flagging before a client notices mid-demo.
Saved views
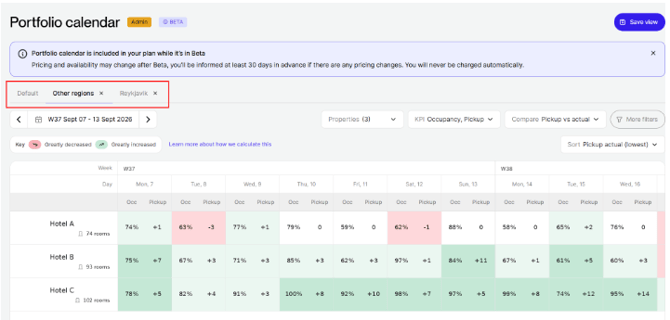
You can create as many saved views as you need. A saved view stores a specific property selection plus filters, shown as its own tab alongside "Default" (which always exists and can't be deleted). For example, if 4 out of 10 properties in a portfolio are naturally comparable (same market, brand, or location), saving those 4 as a view means landing straight on that curated set instead of re-selecting them each time.
- Saved views are per-user — not shared with teammates on the same account.
- Views persist across sessions, and deleting one asks for confirmation first.
Drill-down detail
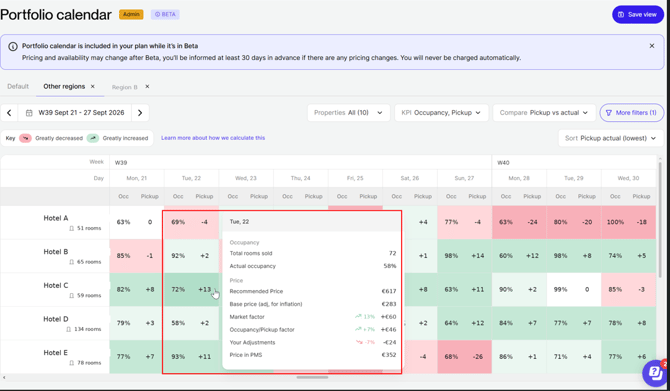
Hovering any date cell opens a card with the full pricing breakdown for that day: occupancy (rooms sold, actual occupancy %), recommended price, base price (both for the reference room type only), market factor, occupancy/pickup factor, manual adjustments, and the price currently in the PMS, the same data available in the single-property calendar.
Two different interactions matter here:
- Clicking a property's name opens that property's own calendar in a new tab; this is currently the only way to make a pricing change. There's no inline edit from the portfolio grid.
- Clicking a date cell is intended to open a detail drawer directly in the portfolio view, but that's coming soon and isn't built yet.
Filters
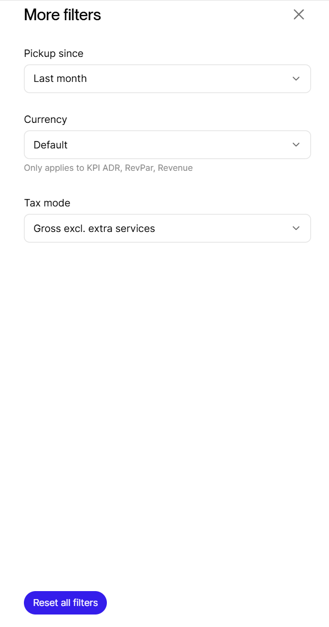
A few additional filters are tucked under More filters, letting you set:
- Pickup since (Yesterday / Last week / Last month), limited to these presets by design, to show trends rather than a fully custom range.
- Currency — applies only to ADR, RevPAR, and Revenue; Occupancy and Pickup are currency-agnostic, and Price is deliberately not converted.
- Tax mode (e.g. Gross excl. extra services).
Which filters appear depends on which KPIs are selected: Pickup since only shows when Pickup is selected, Currency only when ADR/RevPAR/Revenue is selected, and Tax mode only when Revenue is selected.
Note: the date navigator at the top (week by week, plus a calendar picker to jump to any week) is separate from the Pickup since filter.
How to set it up
Navigation path: Calendar → Portfolio (sits alongside the existing Property calendar in the left nav)
- Go to Calendar → Portfolio in the left navigation.
- Select which properties to include using the Properties dropdown (defaults to all).
- Choose up to three KPIs to display as columns.
- Choose a Compare option to drive the color coding on each cell.
- Adjust More filters if needed: Pickup since, Currency, Tax mode.
- Click Save view to store this exact setup as a new tab for quick access later.
Saved views: there's no confirmed cap on how many you can create. Each appears as its own tab (e.g. "Default", "Other regions") and can be closed with the X next to its name, a common pattern is one view per city, region, or brand.
Color coding and Compare: colors are benchmarked either against the property's own Occupancy Strategy settings, or against actual day-over-day pickup, depending on what's selected in Compare. If a client asks why the colors keep changing, the "Learn more about how we calculate this" link on the calendar itself has the full details.